ALUNO
- Home
- Cadastre-se
-
Questões
- Questões de Artes Cênicas
- Questões de Artes Visuais
- Questões de Atualidades
- Questões de Biologia
- Questões de Ciências
- Questões de Ciências Humanas
- Questões de Conhecimentos Gerais
- Questões de Educação Física
- Questões de Espanhol
- Questões de Filosofia
- Questões de Física
- Questões de Fisioterapia
- Questões de Francês
- Questões de Geografia
- Questões de História
- Questões de História e Geografia de Estados e Municípios
- Questões de Inglês
- Questões de Literatura
- Questões de Matemática
- Questões de Matemática Financeira
- Questões de Medicina
- Questões de Música
- Questões de Português
- Questões de Química
- Questões de Raciocínio Lógico
- Questões de Sociologia
- Provas
- Contato
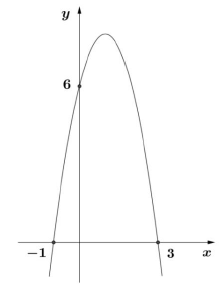
 Os valores de